- MENU
- HOME
- SEARCH
- WORLD
- MAIN
- AFRICA
- ASIA
- BALKANS
- EUROPE
- LATIN AMERICA
- MIDDLE EAST
- United Kingdom
- United States
- Argentina
- Australia
- Austria
- Benelux
- Brazil
- Canada
- China
- France
- Germany
- Greece
- Hungary
- India
- Indonesia
- Ireland
- Israel
- Italy
- Japan
- Korea
- Mexico
- New Zealand
- Pakistan
- Philippines
- Poland
- Russia
- South Africa
- Spain
- Taiwan
- Turkey
- USA
- BUSINESS
- WEALTH
- STOCKS
- TECH
- HEALTH
- LIFESTYLE
- ENTERTAINMENT
- SPORTS
- RSS
- iHaveNet.com: United States
Immigrant Population at Record Highs
by Niall McCarthy (Statista)
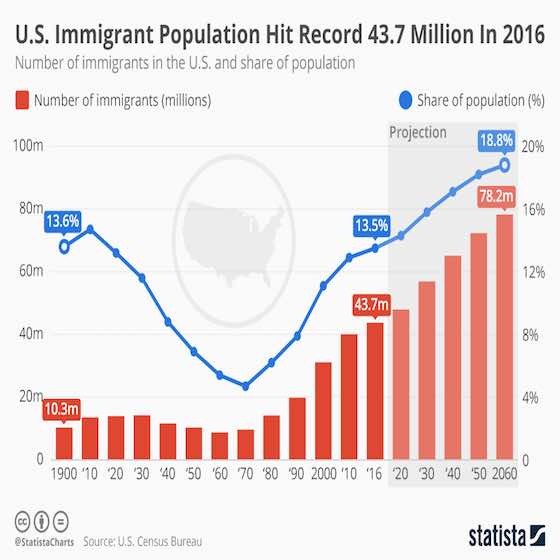
The immigrant population in the United States hit a record 43.7 Million poeple. This chart shows the number of immigrants in the United States and share of the population since 1900 with projections out tp 2060.
New data released by the U.S. Census Bureau has revealed that the American immigrant population, both illegal and illegal, hit a record 43.7 million last summer. That marks an increase of half a million since 2015 and 12.6 million since 2000.
The immigrant share of the U.S. population has reached 13.5 percent, its highest share in 106 years. The all-time highest share was 14.7 percent, recorded in 1910 when the country had 13.5 million immigrants.
The Census Bureau has projected that this will be eclipsed by 2030 when the immigrant share climbs even further to 15.8 percent or just under 57 million people. The steady influx will continue right up to 2050 when the number of immigrants is expected to top 72 million while the population share will increase further to 18.2 percent.
Overall growth slowed, but Middle Eastern, non-Mexico Latin American, Asian, and sub-Saharan African populations grew substantially.
Among the findings in the new data from the Census Bureau:
The nation's immigrant population (legal and illegal) hit a record 43.7 million in July 2016, an increase of half a million since 2015, 3.8 million since 2010, and 12.6 million since 2000.
As a share of the U.S. population, immigrants (legal and illegal) comprised 13.5 percent, or one out of eight U.S. residents in 2016, the highest percentage in 106 years. As recently as 1980, just one out of 16 residents was foreign-born.
Between 2010 and 2016, 8.1 million new immigrants settled in the United States. New arrivals are offset by the roughly 300,000 immigrants who return home each year and annual natural mortality of about 300,000 among the existing foreign-born population.2 As a result, growth in the immigrant population was 3.8 million 2010 to 2016.3
In addition to immigrants, there were slightly more than 16.6 million U.S.-born minor children with an immigrant parent in 2016, for a total of 60.4 million immigrants and their children in the country.4 Immigrants and their minor children now account for nearly one in five U.S. residents.
Mexican immigrants (legal and illegal) were by far the largest foreign-born population in the country in 2016. Mexico is the top sending country, with 1.1 million new immigrants arriving from Mexico between 2010 and 2016, or one out of eight new arrivals. However, because of return migration and natural mortality among the existing population, the overall Mexican-born population has not grown in the last six years.5
The sending regions with the largest numerical increases in the number of immigrants living in the United States 2015 to 2016 were the Caribbean (up 120,522), the Middle East (up 109,113), Central America (up 70,664), Sub-Saharan Africa (up 67,198), South Asia (up 64,902), and South America (up 61,462).6
Longer term, the regions with the largest numerical increases 2010 to 2016 were East Asia (up 892,209), South Asia (up 889,878), the Caribbean (up 554,903), the Middle East (up 471,029), Sub-Saharan Africa (up 456,989), Central America (up 402,784), and South America (up 249,660).
The sending countries with the largest numerical increases since 2010 were India (up 654,202), China (up 550,022), the Dominican Republic (up 206,134), El Salvador (up 172,973), Cuba (up 166,939), the Philippines (up 164,077), Honduras (up 128,478), Vietnam (up 112,218), Venezuela (up 106,185), Guatemala (up 104,883), Nigeria (up 87,565), Pakistan (up 83,271), Haiti (up 81,074), Bangladesh (up 80,949), Jamaica (up 76,532), Ethiopia (up 71,332), Brazil (up 69,982), Colombia (up 68,032), Iraq (up 61,787), Burma (also known as Myanmar, up 60,294), Nepal (up 59,992), and Saudi Arabia (up 54,833).
The sending countries with the largest percentage increases in the number of immigrants living in the United States since 2010 were Saudi Arabia (up 122 percent), Nepal (86 percent), Afghanistan (up 74 percent), Burma (up 73 percent), Syria (up 62 percent), Venezuela (up 58 percent), Bangladesh (up 53 percent), Kenya (up 46 percent), Ethiopia (up 41 percent), Nigeria (up 40 percent), Iraq (up 39 percent), Ghana (up 37 percent), India (up 37 percent), Egypt (up 32 percent), Pakistan (up 28 percent), and China (up 25 percent).
The states with the largest numerical increases in the number of immigrants from 2010 to 2016 were Texas (up 587,889), Florida (up 578,468), California (up 527,234), New York (up 238,503), New Jersey (up 171,504), Massachusetts (up 140,318), Washington (up 134,132), Pennsylvania (up 131,845), Virginia (up 120,050), Maryland (up 118,175), Georgia (up 95,353), Nevada (up 78,341), Arizona (up 78,220), Michigan (up 74,532), Minnesota (up 73,953), and North Carolina (up 70,501).
The states with the largest percentage increases in the number of immigrants 2010 to 2016 were North Dakota (up 48 percent), West Virginia (up 41 percent), South Dakota (up 39 percent), Delaware (up 24 percent), Nebraska (up 20 percent), Minnesota (up 20 percent), Wyoming (up 19 percent), Pennsylvania (up 18 percent), Alaska (up 16 percent), Indiana (up 16 percent), Florida (up 16 percent), Nevada (up 15 percent), Washington (up 15 percent), Iowa (up 15 percent), Maryland (up 15 percent), Massachusetts (up 14 percent), Texas (up 14 percent), Utah (up 13 percent), Wisconsin (up 13 percent), and Virginia (up 13 percent).
WORLD | AFRICA | ASIA | EUROPE | LATIN AMERICA | MIDDLE EAST | UNITED STATES | ECONOMICS | EDUCATION | ENVIRONMENT | FOREIGN POLICY | POLITICS
Immigrant Population at Record Highs - United States Current Events